Av. Mariscal La Mar 550, Of.406
Miraflores, Lima
+51 (01) 7772037
proyectos@neurometrics.la
USA
66 West Flagler St. #976
Miami, Florida +1 (415) 237 3339
projects@neurometrics.la
Cyber & IA Program
The II Specialized Program on Policies for Cyberspace and Artificial Intelligence is a joint academic initiative organized by Neurometrics, the Ministry of Defense of Peru, and the Center for National Higher Studies (CAEN), with sponsorship from Palo Alto Networks and support from the Jack D. Gordon Institute for Public Policy – Florida International University.
The Program aims to provide senior officials from private and public institutions with a strategic understanding of the current state of international debates related to cyberspace and artificial intelligence. Participants will explore key concepts as well as legal, technological, economic, and geopolitical aspects linked to cyberspace.
You can find information about the 2025 edition at this link
OBJECTIVES
Strengthen strategic competencies: Participants will learn about developments, debate lines, and challenges in cyberspace and artificial intelligence.
Update knowledge on emerging threats: The program will provide an updated view on trends and threats in cyberspace.
Promote interinstitutional collaboration: The program encourages the exchange of best practices, creating a collaborative environment to tackle common challenges in cyberspace.
TARGET AUDIENCE
This program is designed for professionals in the public sector with strategic responsibilities related to artificial intelligence and cyberspace projects, business leaders focused on national development, academics working on digital and cyberspace-related topics, and senior officers of the Armed Forces with strategic responsibilities. Applications will be part of a selection process based on professional experience and career trajectory. The program has limited vacancies, and registration will be considered in the order applications are received. Applicants selected will be notified starting February 15 at the email address provided in their registration.
This second edition, free of charge, is possible thanks to the effort and support of the institutions involved.
The event is in Spanish but will include simultaneous translation for presentations delivered in English.
WEDNESDAY, MARCH 4 (virtual via Zoom – for all registered participants)
The agenda will be published in the coming weeks.
CERTIFICATION
A digital certificate will be awarded only to those participants who attend at least 90% of the virtual program, according to Zoom attendance records.
“For inquiries, contact us via WhatsApp in the bottom-right corner.”
Cyber & AI
Today’s digital society offers significant benefits, such as increased productivity and access to new opportunities, but it also introduces new challenges. As digital assets and spaces gain relevance, they have become new sources of vulnerability, reshaping traditional notions of security. In this context, cybersecurity and cyberdefense are essential pillars: cybersecurity protects systems and data from attacks, while cyberdefense safeguards critical national infrastructure and responds to threats in cyberspace.
Both are crucial to ensuring trust and security in the digital world.Research in these fields is especially important for low-tech countries, such as those in Latin America, which face greater vulnerability due to limited resources and expertise. At Neurometrics, we recognize the importance of exploring these emerging security dimensions and actively conduct research and projects to contribute to the development of this field.
Below are our publications focused on cybersecurity and cyberdefense:
In the year 2017, we saw the opportunity to give another use to eye-tracking technology and machine learning and apply it to health. That way, BRILAB was created.
WHAT DO WE DO?
BRILAB is a technological development project in web platform format that analyzes and records eye behavior data for the prediagnosis of ASD. Combining the data of eye behavior and Machine Learning algorithms, a prediagnosis can be generated in minutes. The program is directed to children that go through a standardized test and can be then derived to an specialist.
HOW DOES IT WORK?
This report comprises a series of indicators showing the probability and scale in which each participant with Autism Spectrum Disorder can be located.
Illustration 1 shows a scoreboard for the prediagnosis of ASD in an infant. In the initial part, you can see the stimuli used and made visible to the infant during the pilot test. With the data recorded and uploaded to the platform, the online report on prediagnosis can be seen in the central part according to the defined metrics and patterns. Finally, the infant’s conditions are detailed based on the parameters established on ocular behavior.
Qualified as a Technological Development Project – Law No.30309 according to Sub-Director Resolution No. 945-2019-CONCYTEC/SDCTT of July 22, 2019
Understanding the shopper through visual attention
In Peru, the shampoo industry is made up of many brands that compete to increase their market share. Among the leading companies are Procter & Gamble, Unilever, and L’Oréal. Furthermore, over the last five years, new brands and product lines dedicated to hair care have entered the Peruvian market, offering new value propositions in their products (El Comercio, 2014; Biotop Professional, 2018; Gestión, 2015). As a result of the growth of the shampoo industry and the increasingly competitive environment, it is necessary for companies in this sector to analyze and understand the behavior of the Peruvian consumer in the hair-care product purchase process.
The objective of the study was to analyze shopper behavior during the purchase process at the point of sale within the hair-care category. Likewise, the specific objectives were to analyze visual attention to: shelves, packaging, prices, and advertising materials for shampoos.
PROCEDURE
A group of women between 18 and 45 years old was recruited at the same supermarket and given a shopping context that included a shampoo, a soap, and a deodorant for personal use. This context described the situation and the need. Participants were also reminded that there was no time limit to choose the products and that, after making their selection, they should proceed to checkout.
The study used eye-tracking technology to record eye movements in response to specific stimuli (Gonzáles & Velásquez, 2012). This method is used to examine the effect of consumer attention on information processing, preferences, and choice and evaluation behavior (Van Loo, Grebitus, Nayga, Verbeke, & Roosen, 2018). Similarly, Meyerding and Merz (2018) recommend eye tracking to study consumer attention because it allows the evaluation of the consumer’s selection and observation process.
Based on the recorded information, the following questions were addressed:
What relationship exists between visual attention and purchase intention at the point of sale?
How much visual attention time does the shopper dedicates to the hair-care category?
Is my brand being seen by shoppers at the point of sale?
How do shoppers interact with the packaging?
How much visual attention time does the shopper spend reading packaging information?
Are buyers of other brands seeing my product?
What other brands are buyers of my brand looking at?
Is price relevant for the category?
Is point-of-sale advertising material relevant for generating purchase intention?
FINDINGS
1. Shopper behavior when choosing a brand in the supermarket
The shopper performs a rapid visual scan.
Brands have between 0.5 and 3 seconds to capture attention along the shelf.
The point of entry to the shelf is relevant—the side from which the shopper approaches impacts those first seconds of visibility, as the shopper does not necessarily walk the entire aisle.
Heatmap entering the gondola by the LEFT and by the RIGHT SIDES
Then, the shopper observes and compares—brands have between 7 and 10 seconds to communicate their portfolio and the most relevant product features.
Video of shopper observing and comparing
2. Which areas of a shelf are the most visible?
The top front row is the most effective—the impact of the second and third rows may depend on the packaging layout used.
How does the shopper interact with brand packaging?
Packaging design generates different behaviors. In packages with a lower information load, time is mainly devoted to the logo and the variant, without the need to read detailed descriptions.
Heatmap Pantene, Elvive, Dove
The time spent understanding information may allow shoppers to move from one package to another more quickly and thus, compare more versions.
3. Price, product, promotional material
Hair care: a category where price matters.
85% of shoppers looked at the prices and devoted 27% of their visual attention time to them.
38% of shoppers looked at some promotional material on the shelf, dedicating 3% of their visual attention time to it.
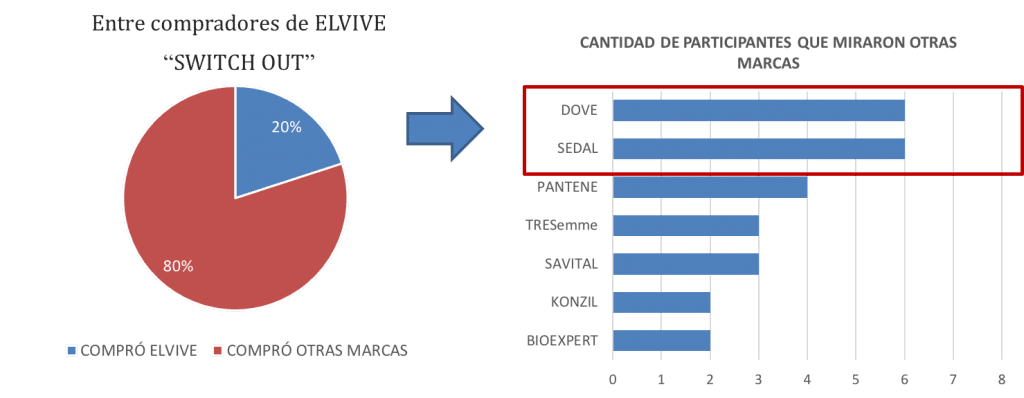
4. Brands that share visual attention
Protecting Switch-out
Of the people who purchased ELVIVE, how many looked at the main competing brands?
Sample: 8 participants purchased ELVIVE
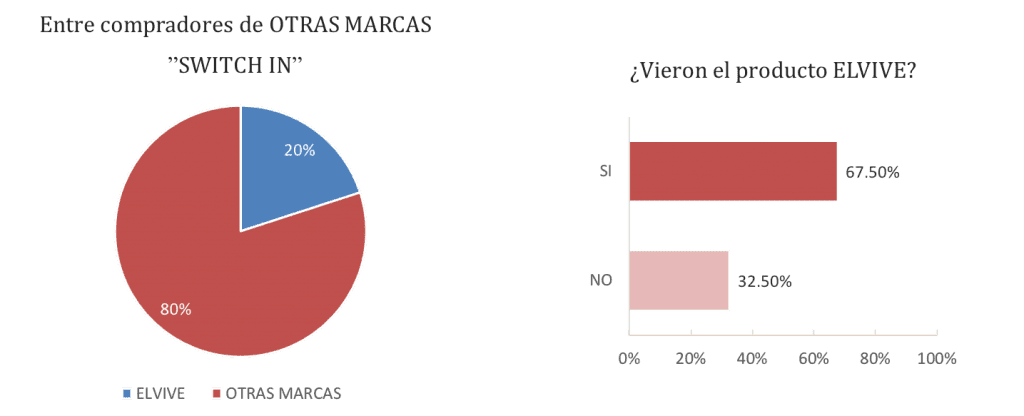
Capture Switch-in
Capturing buyers of other brands who saw the ELVIVE product on the shelf.
On average, 1 out of every 3 people did not see the ELVIVE product on the shelf.
Sample: 32 participants that bought another brand
5. Relationship between visibility and purchase intention
The greater the consumer’s visual attention to a specific shampoo brand, the higher the purchase intention. However, there were atypical cases, such as Sedal and Konzil, that captured visual attention but did not convince shoppers to make the purchase.
The greater the consumer’s visual attention to the price of a shampoo brand, the greater the purchase intention.
“85% of shoppers looked at the price and devoted 27% of the total visual attention time on the shelf to it.”
Attention map of the gondola. Source: Neurometrics
Brands had between 0.5 and 3 seconds to capture the shopper’s initial attention along the shelf, and the shopper does not necessarily walk the entire aisle.
Brands have less than 10 seconds to communicate their portfolio and relevant features through packaging.
Of the total participants who did not select a given brand, nearly one third did not see that brand at the point of sale, despite it being displayed.
RECOMMENDATIONS
Shopper’s behavior on the shelf
Location is essential to generate visibility during the initial scan, which lasts between 0.5 and 3 seconds.
If the brand is located at one end of the shelf, it is important to know which end has higher traffic.
2. High-visibility shelf zones
Place the franchise you most want to promote in the top front row.
Test different product layouts to optimize visual attention time for the second and third rows.
3. Packaging Interaction
Complex packaging makes it difficult to identify the franchise, considering the short time (between 7 and 10 seconds) a shopper devotes to evaluation and comparison on the shelf .
Having in-store biometric reports that complement customer understanding through multiple information sources adds new perspectives to marketing decision-making and improves effectiveness.
It was presented at Talkin 2019, SIUMER 2019, ESOMAR Brazil 2019, and the Cosmetics and Hygiene Guild of the Lima Chamber of Commerce.
The positive side of Artificial Intelligence in industries
There is widespread discussion about how Artificial Intelligence will lead to the loss of many jobs. However, if we look at the evolution of work, technology has mainly replaced certain manual tasks. From a positive perspective, by eliminating and automating manual tasks within organizations. AI allows machines to take over these activities, freeing human capacity to be used in more complex analytical roles and in other areas where artificial intelligence cannot yet be fully trusted.
The industries that have adapted most successfully to artificial intelligence are retail, banking, and insurance. Tourism companies follow closely, using AI to analyze large volumes of data and anticipate consumer behavior.
In the context of technological advancement, one area of public employment with significant potential is support services. This area focuses on citizen assistance and manages large amounts of data. In many cases, procedures are still manual and require people to visit offices in person to obtain a service ticket.
One of the main areas in which AI is applied is understanding customer behavior. All companies seek to understand their customers’ preferences in order to send purchase notifications, advertising, and other communications, with the goal of increasing the effectiveness of their actions.
In recent years, we have delegated some of our tasks to mobile devices: ordering food, searching for directions, making calls, and so on. Some users with more intense usage have even entrusted their devices to organize their daily activities
However, as the internet usage has increased, new threats have emerged, reorienting countries’ security strategies toward a new dimension: cyberspace. Protecting critial digital assets has become essential.
Cyberdefense, as mentioned in the white books of national defense, is now an active component in which it is clearly stated that enemies are invisible, yet potentially devastating.
Cyberattacks are a real and anonymous threat. The number of cases that make the news is far lower than the number that actually occur. As online activity and the digitalization of public services increase, exposure to the risks of cyberattacks also grows.
According to Fortinet, during the first half of 2022 nearly 137 billion attempted cyberattacks were recorded in Latin America. These figures do not suggest a halt in the path toward digitalization; on the contrary, they encourage the development of multisectoral cyber defense and cybersecurity policies. Public institutions must invest in preventive measures as part of the security–defense system to protect their assets, maintain public trust, and ensure business continuity.
Humans first: Is there resistance to automation based on artificial intelligence?
Digitalization and automation are transforming how various tasks are approached for greater efficiency. However, there are specific contexts where humans prefer human attention. This phenomenon could be considered paradoxical, so it is interesting to explore what is behind this resistance.
In recent years, technology’s ability to process large amounts of data, learn patterns, and perform tasks has not only improved operational efficiency and decision-making but also opened up new possibilities for industries. AI will impact all industries in areas such as customer operations, marketing and sales, and research and development (R&D), promising a future of enhanced productivity and innovation.
More advanced algorithms allow machines to become progressively more skillful and better suited to replace some of the functions people perform. Concern about the loss of jobs due to the automation of the workforce makes visible the resistance of some towards change.
This resistance can manifest in a preference for human interaction instead of “intelligent” bots. For example, despite having bots active 24 hours a day in customer service, customers prefer traditional service, even if bots could be more efficient.
Despite technological advances, there are aspects of genuine human interaction that AI, for all its capabilities, fails to simulate fully. Empathy, the ability to understand subtle emotions, creativity, and humor are organic elements present even in the simplest interaction. These are the unique qualities that humans bring to the table, reassuring us that our role in certain contexts is irreplaceable. Although some AI s excel in this emulation, AI is usually aimed at ensuring a fast and efficient flow to fulfill the assigned task.
To continue exploring this topic, read the complete article by Freddy Linares, director of Neurometrics, in the Punto de Equilibrio Bulletin Nº46
Symposium: Semblance in present continuous. Pedro Ruiz Cabanillas
This January, the Symposium: Semblance in present continuous, Pedro Ruiz Cabanillas, took place in the research center of San Marcos University, NEURON. Freddy Linares, director of Neurometrics, gave a presentation about visual attention. Here are some notes about his presentation.
Visual Attention and Eye-tracking
The amount of text in phone apps is increasing, and there is a predominance of audiovisual elements and immediate responses. Society is migrating toward a preference for consuming this kind of content. For that reason, understanding the dynamics of eye tracking is becoming more important today.
Biometric analysis
During our interaction with the environment, we register a series of information, which we capture through our senses and which, based on the reactions of our different organs, can be measured through some biometric technologies, such as EEG, Heart Rate, Facial Coding, Eyetracking, and Galvanic Skin Response (GSR).
Eye-Tracking
We understand eye tracking as the technology that allows us to objectively record the eye fixation points, saccadic movements, and pupillary dilation of certain participants when faced with a stimulus for each eye and measured in milliseconds.
Visual Attention
There are two types of visual attention:
Bottom-Up attention: this is automatic attention, the moment we find ourselves looking at something, in a supermarket, for example, without having been interested in looking at it.
Top-Down attention: occurs when one explicitly searches for something specific, such as a particular category.
Eye Tracking
Eye tracking devices have sensors that illuminate the back of the eye as if highlighting it from the inside out so that the pupil stands out. So, the camera that focuses on the eyes can identify it. This is then processed with software, and it calculates specifically what part of what one is looking at, be it a screen or a physical location, which is what needs to be recorded. Fixed eye tracking devices analyze things that can be displayed on the screen, such as a website, an image, a video, or video games.
Eye tracking lenses are for when the person has to be moving, for example, someone walking in a supermarket, a vehicle driver, among other cases. Technology adapts and is available to carry out research.
Data and content in a future of biometric and artificial intelligence
Data and content in a future of biometric and artificial intelligence Nowadays, personal and behavioral data have become highly valuable online inputs. There is an increasing capacity for data analysis, so companies in different areas try to collect more data differently. A lot of user information is protected, such as emails, passwords, etc. However, there is data that is public, such as publications or preferences, which implies the risk of revealing sensitive information.
Companies like Google or Facebook use the activity we leave online as valuable input and to personalize their recommendation and advertising algorithms. The US government has even tried to sue Facebook for purchasing its rivals since, in this way, it harms competitors and users who would be losing control over their information.
Generative AIs represent a new challenge regarding data use and collection. For example, in the case of image-generating AI, Lensa AI generates images based on other photos used as input. This creates complications when defining the owner of these productions, especially when the terms and conditions of this application are suspiciously broad.
Startups seek new ways to capture data, including directly compensating users. An example is the Worldcoin cryptocurrency, which rewards users for verifying their identity with iris scanning. Users receive Worldcoin tokens, joining a base of over 2.3 million people. Although Worldcoin is presented as a universal basic income initiative, the collection of biometric data gives it a significant advantage in this current trend.
Biometrics is an example of valuable data, and it represents a form of identification by recording the geography of the iris or fingerprints. There are biometric authentication initiatives that allow the unique physiological data of each individual to be used as very high-precision identifiers that differ from traditional authentication methods that can be stolen or forgotten.
The frenetic expansion of technology has established a global digital society that is much more dynamic, connected, and active than ever. The Internet is the center of digital activity, where different activities and essential processes related to work, education, health, entertainment, and more are transferred. Knowing how to use the Internet can define the potential of a society to take advantage of its different benefits and enhance its development. Otherwise, there is a risk of becoming obsolete and uncompetitive. That is why it is necessary to know more precisely about the digital activity in the Peruvian population. With adequate information, knowing how much, how, or where to improve will be possible. This index seeks to mark the beginning of a much more straightforward path towards a digital Peru.
What is digital activity?
Digital activities represent the different types of use a person gives to the Internet and, therefore, the scope of what they can do in the digital world. Thus, using the Internet for different purposes (such as communicating, entertaining, doing paperwork, and educating yourself) reflects a high level of digital activity and the exercise of different basic digital skills. The main question is: How much digital activity is there in the Peruvian population?
How was this index made?
The Digital Activity Index (InAD Perú) is based on the methodology Alkire-Foster for measuring multidimensional poverty. Information from the National Survey of Homes (ENAHO) from the first two trimesters of 2023 about “how people used the internet service last month” was used. The nine digital activities* considered represent the dimensions of the Internet where the Peruvian population ** population manages to develop. The online activities have different values, and they were grouped into three groups (basic, intermediate, and advanced) because they vary in terms of frequency, complexity, impact on the user, and skills required to perform them. In this way, the InAd measures the exercise of digital skills in a particular age group, region, or other classification criteria. The InAD takes values between 0 and 1, where 1 represents the entire population.
*Based on ENAHO question 316, used for the index, the digital activities considered are obtaining information, communicating, buying products and/or services, carrying out electronic banking operations and other financial services, being formally educated or trained, making transactions with state organizations/public authorities, engaging in entrepreneurial activities, selling products and/or services, and downloading antivirus/programs.
**ENAHO question 316, used for the index, considered people six years old and older.The population with valid records and without gaps was 104,550 individuals nationwide.
VALUES OF InAD PERÚ 2023 T1-T2
The InAD Perú 2023 T1-T2 is: 0.1672
The 3 digital activities most exercised by Peruvians are:
Communication: 61.97 % of Peruvians did it .
Entertainment activities: 58.87 % of Peruvians did them.
Obtaining information: 52.1 % of Peruvians did it.
The 3 digital activities least exercised by Peruvians:
Selling products or/and services: only 2.41% of Peruvians did it.
Make transactions with state organizations/public authorities: only 6.32% of Peruvians did it.
Buy products and services: only 7.43% of Peruvians did it.
The InaD according to age ranges:
Infant (6 – 11 years): 0.0688
Teenager(12 – 18 years): 0.1828
Young adult (19-26 years): 0.2986
Adult (27-59 years): 0.1956
Elderly (60 years or more): 0.0643
Presentation of InAD PERU 2023
19th NeuroPsychoEconomics Conference
The 19th Annual NeuroPsychoEconomics Conference will be held in Granada, Spain, on June 08 and 09 this year.
The theme of the 2023 conference is: “The strides of neuroeconomics: Revealing the neural and psychological underpinnings of economic decision making.” In addition to exchanging and learning about advances in the emerging field of neuroeconomics and consumer neuroscience, the event will feature two of the most prestigious exponents of the field internationally: Ale Smidts, Professor of Marketing at Erasmus University Rotterdam (Netherlands), and Vinod Venkatraman, Associate Professor of Marketing at Temple University (USA).
In this edition, the Neurometrics Behavioral Lab team was invited to participate in the research paper entitled “Attention and perception of anti-smoking advertisements with varying valence among millennials and centennials in Peru during the Covid-19 pandemic”. The paper will be presented by MSc. Freddy Linares-Torres.
This research analyzed how an anti-smoking advertisement’s emotional valence influences the public’s visual attention and perception using one of the leading biometric tools: eye-tracking.